Why does reporting get forgotten in ITSM projects?

ITSM initiatives often focus heavily on operational requirements, without paying enough up-front attention to reporting and analytics. This can lead to increased difficulty after go-live, and lost opportunity for optimisation. Big data is a huge and important trend, but don’t forget that a proactive approach to ordinary reporting can be very valuable.

“…users must spend months fighting for a desired report, or hours jockeying Excel spreadsheets to get the data they need. I can only imagine the millions of hours of productive time spent each month by people doing the Excel “hokey pokey” each month to generate a management report that IT has deemed not worthwhile”

Don’t Forget About “Small Data” – Patrick Gray in TechRepublic

In a previous role, aligning toolsets to processes in support of our organisation’s ITSM transformation, my teammates and I used to offer each other one piece of jokey advice: “Never tell anyone you’re good with Crystal Reports”.

The reason? Our well established helpdesk, problem and change management tool had become a powerful source of management reports. Process owners and team managers wanted to arrive at meetings armed with knowledge and statistics, and they had learned that my team was a valuable data source.

Unfortunately, we probably made it look easier than it actually was. These reports became a real burden to our team, consuming too much time, at inconvenient times. “I need this report in two hours” often meant two hours of near-panic, delving into data which hadn’t been designed to support the desired end result. We quickly needed to reset expectations. It was an important lesson about reporting.

Years later, I still frequently see this situation occurring in the ITSM community. When ITSM initiatives are established, processes implemented, and toolsets rolled out, it is still uncommon for reporting to be considered in-depth at the requirements gathering stage. Perhaps this is because reporting is not a critical-path item in the implementation: instead, it can be pushed to the post-rollout phase, and worried about later.

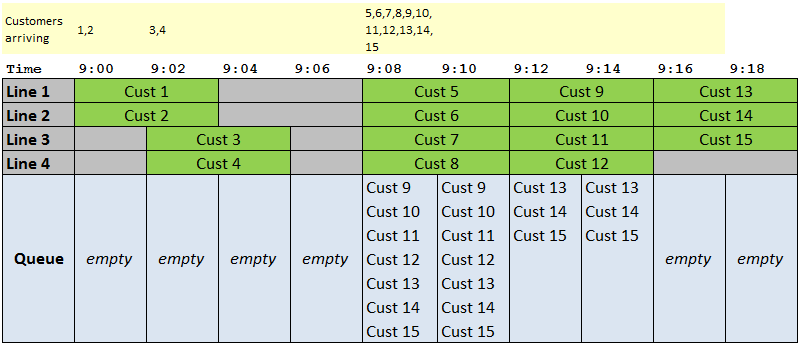
One obvious reason why this is a mistake is that many of the things that we might need to report on will require specific data tracking. If, for example, we wish to track average assignment durations, as a ticket moves between different teams, then we have to capture the start and end times of each. If we need to report in terms of each team’s actual business hours (perhaps one team works 24/7, while another is 9 to 5), then that’s important too. If this data is not explicitly captured in the history of each record, then retrospectively analysing it can be surprisingly difficult, or even impossible.

Consider the lifecycle of a typical ITSM data instance, such as an incident ticket:

Simple representation on an incident ticket in three phases: live, post-live, and archives

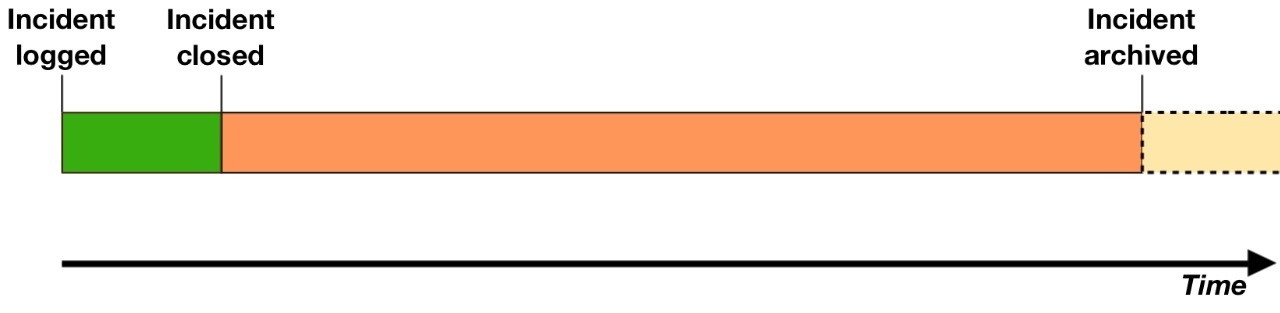
Our record effectively moves through three stages:

  • 1: The live stage
    This is the key part of an incident’s record’s life, in which it is highly important as a piece of data in its own right. At this point, there is an active situation being managed. The attributes of the object define where it is in the process, who owns it, what priority it should take over other work, and what still needs to be done. This phase could be weeks long, near-instantaneous, or anything between.
  • 2: The post-live stage
    At this point, the ticket is closed, and becomes just another one of the many (perhaps hundreds of thousands) incidents which are no longer actively being worked. Barring a follow up enquiry, it is unlikely that the incident will ever be opened and inspected by an individual again. However, this does not mean that it has no value. Incidents (and other data) in this lifecycle phase do not have much significant value in their own individual right (they are simply anecdotal records of a single scenario), but together they make up a body of statistical data that is, arguably, one of the IT department’s most valuable proactive assets.
  • 3: The archived stage
    We probably don’t want to keep all our data for ever. At some stage, the usefulness of the data for active reporting diminishes, and we move it to a location where it will no longer slow down our queries or take up valuable production storage.

It’s important to remember that our ITSM investment is not just about fighting fires. Consider two statements about parts of the ITIL framework (these happen to be taken from Wikipedia, but they each seem to be very reasonable statements):

Firstly, for Incident Management:

“The objective of incident management is to restore normal operations as quickly as possible”

And, for Problem Management:

“The problem-management process is intended to reduce the number and severity of incidents and problems on the business”

In each case, the value of our “phase 2” data is considerable. Statistical analysis of the way incidents are managed – the assignment patterns, response times and reassignment counts, first-time closure rates, etc. – helps us to identify the strong and weak links of our incident process in a way that no individual record can do so. Delving into the actual details of those incidents in a similar way helps us to identify what is actually causing our issues, reinforcing Problem Management.

It’s important to remember that this is one of the major objectives of our ITSM systems, and a key basis of the return on our investment. We can avoid missing out on this opportunity by following some core principles:

  • Give output requirements as much prominence as operational requirements, in any project’s scope.
  • Ensure each stakeholder’s individual reporting and analytics needs are understood and accounted for.
  • Identify the data that actually needs to be recorded, and ensure that it gets gathered.
  • Quantify the benefits that we need to get from our analytics, and monitor progress against them after go-live.
  • Ensure that archiving strategies support reporting requirements.

Graphs icon courtesy of RambergMediaImages on Flickr, used under Creative Commons licensing.

Advertisement

Congestion charging… in IT?

Congestion Charge sign in London

Does your organization understand the real costs of the congestion suffered by your IT services? Effective management and avoidance of congestion can deliver better service and reduced costs, but some solutions can be tough to sell to customers.

The Externalities of Congestion

In 2009, transport analyst and activist Charles Komanoff published, in an astonishingly detailed spreadsheet, his Balanced Transportation Analysis for New York City.  His aim was to explore the negative external costs caused by the vehicular traffic trying to squeeze into the most congested parts of the city each day.

His conclusion? In the busiest time periods, each car entering the business district generates congestion costs of over $150.

Graph showing Congestion Costs outlined in Komanoff's Balanced Transportation Analysis
Congestion Costs outlined in Komanoff’s Balanced Transportation Analysis

Komanoff’s spreadsheet can be downloaded directly here. Please be warned: it’s a beast – over three megabytes of extremely complex and intricate analysis. Reuters write Felix Salmon succinctly stated that “you really need Komanoff himself to walk you through it“.

Komanoff’s work drills into the effect of each vehicle moving into the Manhattan business district at different times of day, analyzing the cascading impact of each vehicle on the other occupants of the city.  The specific delays caused by any given car on any other given vehicle is probably tiny, but the cumulative effect is huge.

The Externalities of Congested IT Services

Komanoff’s city analysis models the financial impact of a delay to each vehicle, such as commercial vehicles, carring several paid professionals, travelling to fulfil charged-for business services.  With uncontrolled access to the city, there is no consideration of the “value” of each journey, and thus high-value traffic (perhaps a delivery of expensive retail goods to an out-of-stock outlet) gets no prioritization over any lower value journey.

Congested access to IT resources, such as the Service Desk, has equivalent effects.  Imagine a retail unit losing its point-of-sale systems on the Monday morning that a HQ staff return from their Christmas vacation.  The shop manager’s frantic call may find itself queued behind dozens of forgotten passwords.  Ten minutes of lost shop business will probably cost far more than a ten minute delay in unlocking user accounts.

That’s not to say that each password reset isn’t important.  But in a congested situation, each caller is impacted by, and impacts, the other people calling in at the same time.

The dynamics and theory of demand management in call centers have been extensively studied and can be extremely complex (a google search reveals plentiful studies, often with complex and deep mathematical analysis. This is a by no means the most example!).

Fortunately, we can illustrate the effects of congestion with a relatively simple model.

Our example has the following components:

  • Four incoming call lines, each manned by an agent
  • A group of fifteen customers, dialling-in at or after 9am, with incidents which each take 4 minutes for the agent to resolve.
  • Calls arriving at discrete 2-minute intervals (this is the main simplification, but for the purposes of this model, it suffices!)
  • A call queuing system which can line up unanswered calls.

When three of our customers call in each 2-minute period, we quickly start to build up a backlog of calls:

Congestion at the Service Desk - a table models the impact of too many customers arriving in each unit of time.
With three calls arriving at the start of each two-minute interval, a queue quickly builds.

We’ve got through the callers in a relatively short time (everything is resolved by 09:16). However, that has come at a price: 30 customer-minutes of waiting time.

If we spread out the demand slightly, and assume that only two customers call in at the start of each two-minute period, however, the difference is impressive:

Table showing a moderated arrival rate at the service desk, resulting in no queueing
If the arrival rate is slowed to two callers in each time period, no queue develops

Although a few users (customers 3,7, 11 and 15) get their issues resolved a couple of minutes later in absolute terms, there is no hold time, for anyone.  Assuming there are more productive things a user can be doing other than waiting on hold (notwithstanding their outstanding incident), the gains are clear.  In the congestion scenario, the company has lost half an hour of labour, to no significant positive end.

Of course, while Komanoff’s analysis is comprehensive, it is one single model and can’t be assumed completely definitive. But it is undeniable that congestion imposes externalities.

Komanoff’s proposed solution involves a number of factors, including:

  • A congestion charge, applying at all levels of day, with varying rates, applying to anyone wishing to bring a car into the central area of the city.
  • Variable pricing on some alternative transportation methods such as trains, with very low fares at off-peak times.
  • Completely free bus transport at ALL times.

Congestion management of this kind is nothing new, of course.  London, having failed to capitalize on its one big chance to remodel its ancient street layout, introduced a central, flat-fare central congestion charge in 2003.  Other cities have followed suit (although proposals in New York have not come to fruition). Peak time rail fares and bridge tolls are familiar concepts in many parts of the world. Telecoms, the holiday industry, and numerous other sectors vary their pricing according to periodic demand.

Congestion Charging in IT?

Presumably, then, we can apply the principles of congestion charging to contested IT resources, implementing a variable cost model to smooth demand? In the case of the Service Desk, this may not always be straightforward, simply because in many cases the billing system is not a straightforward “per call” model. And in any case, how will the customer see such a proposal?

Nobel Laureate William S. Vickery is often described as “the father of congestion charging”, having originally proposed it for New York in 1952. Addressing the objections to his idea, he said:

“People see it as a tax increase, which I think is a gut reaction. When motorists’ time is considered, it’s really a savings.”

If the customer agrees, then demand-based pricing could indeed be a solution. A higher price at peak times could discourage lower priority calls, while still representing sufficient value to those needing more urgent attention. This model will increasingly be seen for other IT services such as cloud-based infrastructure.

There are still some big challenges, though. Vickrey’s principles included the need to vary prices smoothly over time. If prices suddenly fall at the end of a peak period, this generates spikes in demand which themselves may cause congestion. In fact, as our model shows, the impact can be worse than with no control at all:

Table showing the negative impact of a failed off peak/peak pricing model
If we implement a peak/off-peak pricing system, this can cause spikes. In this case, all but four of the customers wait until a hypothetical cheaper price band starting at 09:08, at which point they all call. there is even more lost time (40 minutes) in the queue than before.

This effect is familiar to many train commuters (the 09:32 train from Reading to London, here in the UK, is the first off-peak service of the morning, and hence one of the most crowded).  However, implementing smooth pricing transitions can be complex and confusing compared to more easily understood fixed price brackets.

Amazon’s spot pricing of its EC2 service is an interesting alternative.  In effect, it’s still congestion pricing, but it’s set by the customer, who is able to bid their own price for spare capacity on the Amazon cloud.

Alternatives?

Even if the service is not priced in a manner that can be restructured in this way, or if the proposition is not acceptable to the customer, there are still other options.

Just as Komanoff proposes a range of positive and negative inducements to draw people away from the congested peak-time roads, an IT department might consider a range of options, such as:

  • Implementation of a service credits system, where customers are given a positive inducement to access the service at lower demand periods, could enable the provider to enhance the overall service provided, with the savings from congestion reduction passed directly to the consumer.
  • Prioritization of access, whereby critical tasks are fast-tracked in priority to more routine activities.
  • Varieable Service Level Agreements, offering faster turnarounds of routine requests at off-peak times. Again, if we can realise Vickrey’s net overall saving, it may be possible to show enhanced overall service without increased overall costs.
  • Customer-driven work scheduling. Apple’s Genius Bar encourages customers to book timeslots in advance. This may result in a longer time to resolution than a first-come-first-served queue, but it also gives the customer the opportunity to choose a specific time that may be more convenient to them anyway. Spare capacity still allows “walk up” service to be provided, but this may involve a wait.
  • Customer self-service solutions such as BMC’s Service Request Management. Frankly, this should be a no-brainer for many organizations. If we have an effective solution which allows customers to both log and fulfil their own requests, we can probably cut a significant number of our 15 customer calls altogether. Self-service systems offer much more parallel management of requests, so if all 15 customers hit our system at once, we’d not expect that to cause any issue.

Of course, there remains the option of spending more to provide a broader capacity, whether this is the expansion of a helpdesk or the widening of roads in a city.  However, when effective congestion management can be shown to provide positive outcomes from unexpanded infrastructure, shouldn’t this be the last resort?

(congestion charge sign photo courtesy of mariodoro on Flickr, used under Creative Commons licensing)

Ticket Tennis

The game starts when something breaks.

A service is running slowly, and the sounds of a room full of frustration echo down a phone line. Somewhere, business has expensively stopped, amid a mess of lagging screens and pounded keyboards.

The helpdesk technician provides sympathetic reassurance, gathers some detail, thinks for a moment, and passes the issue on. A nice serve, smooth and clean, nothing to trouble the line judges here.

THUD!

And it’s over to the application team.  For a while.

“It’s not us. There’s nothing in the error logs. They’re as clean as a whistle”.

Plant feet, watch the ball…

WHACK!

Linux Server Support. Sure footed and alert, almost nimble (it’s all that dashing around those tight right-angle corners in the data center).  But no, it seems this one’s not for them.

“CPU usage is normal, and there’s plenty of space on the system partition”.

SLICE!

The networks team alertly receive it.  “It can’t be down to us.  Everything’s flowing smoothly, and anyway we degaussed the sockets earlier”. (Bear with me. I was never very good at networking).

“Anyway, it’s slow for us, too. It must be an application problem”.

BIFF!

Back to the application team it goes.   But they’re waiting right at the net.  “Last time this was a RAID problem”, someone offers.

CLOUT!

…and it’s a swift volley to the storage team.

I love describing this situation in a presentation, partly because it’s fun to embellish it with a bit of bouncy time-and-motion.  Mostly, though, it’s because most people in the room (at the very least, those whose glasses of water I’ve not just knocked over) seem to laugh and nod at the familiarity of it all.

Often, something dramatic has to happen to get things fixed. Calls are made, managers are shouted at, and things escalate.  Eventually people are made to sit round the same table, the issue is thrashed out, and finally a bit of co-operation brings a swift resolution.

You see, it turns out that the servers are missing a patch, which is causing new application updates to fail, but they can’t write to the log files because the network isn’t correctly routing around the SAN fabric that was taken down for maintenance which has overrun. It took a group of people, working together, armed with proper information on the interdependent parts of the service, to join the dots.

Would this series of mistakes seem normal in other lines of work?  Okay, it still happens sometimes, but in general most people are very capable of actually getting together to fix problems and make decisions.   Round table meetings, group emails and conference calls are nothing new. When we want to chat about something, it’s easy.  If we want to know who’s able to talk right now, it’s right there in our office communicator tools and on our mobile phones:

It’s hard to explain why so many service management tools remain stuck in a clumsy world of single assignments, opaque availability, and uncoordinated actions.  Big problems don’t get fixed quickly if the normal pattern is to whack them over the net in the hope that they don’t come back.

Fixing stuff needs collaboration, not ticket tennis. I’ve really been enjoying demonstrating the collaboration tools in our latest Service Desk product.  Chat simply makes sense.  Common views of the services we’re providing customers simply make sense.  It demos great, works great, and quite frankly, it all seems rather obvious.

Photo courtesy of MeddyGarnet, licensed under Creative Commons.